CO2AI
BCG (Boston consulting group) / Paris
CO2AI is a Sustainability-as-a-Service software platform designed to help large organizations measure, track, and reduce their environmental footprint at scale, with a particular focus on complex supply chains.
Project
Co2 AI
Role
Sn. UX Designer
Year
Mar 2022 - Sept 2022
Context
As the lead designer for the measuring component of the platform, my primary challenge was to create an intuitive interface for companies to navigate and analyze their multi-layered emissions data. The main problem we faced was the complexity and density of emissions data across various scopes and factors.
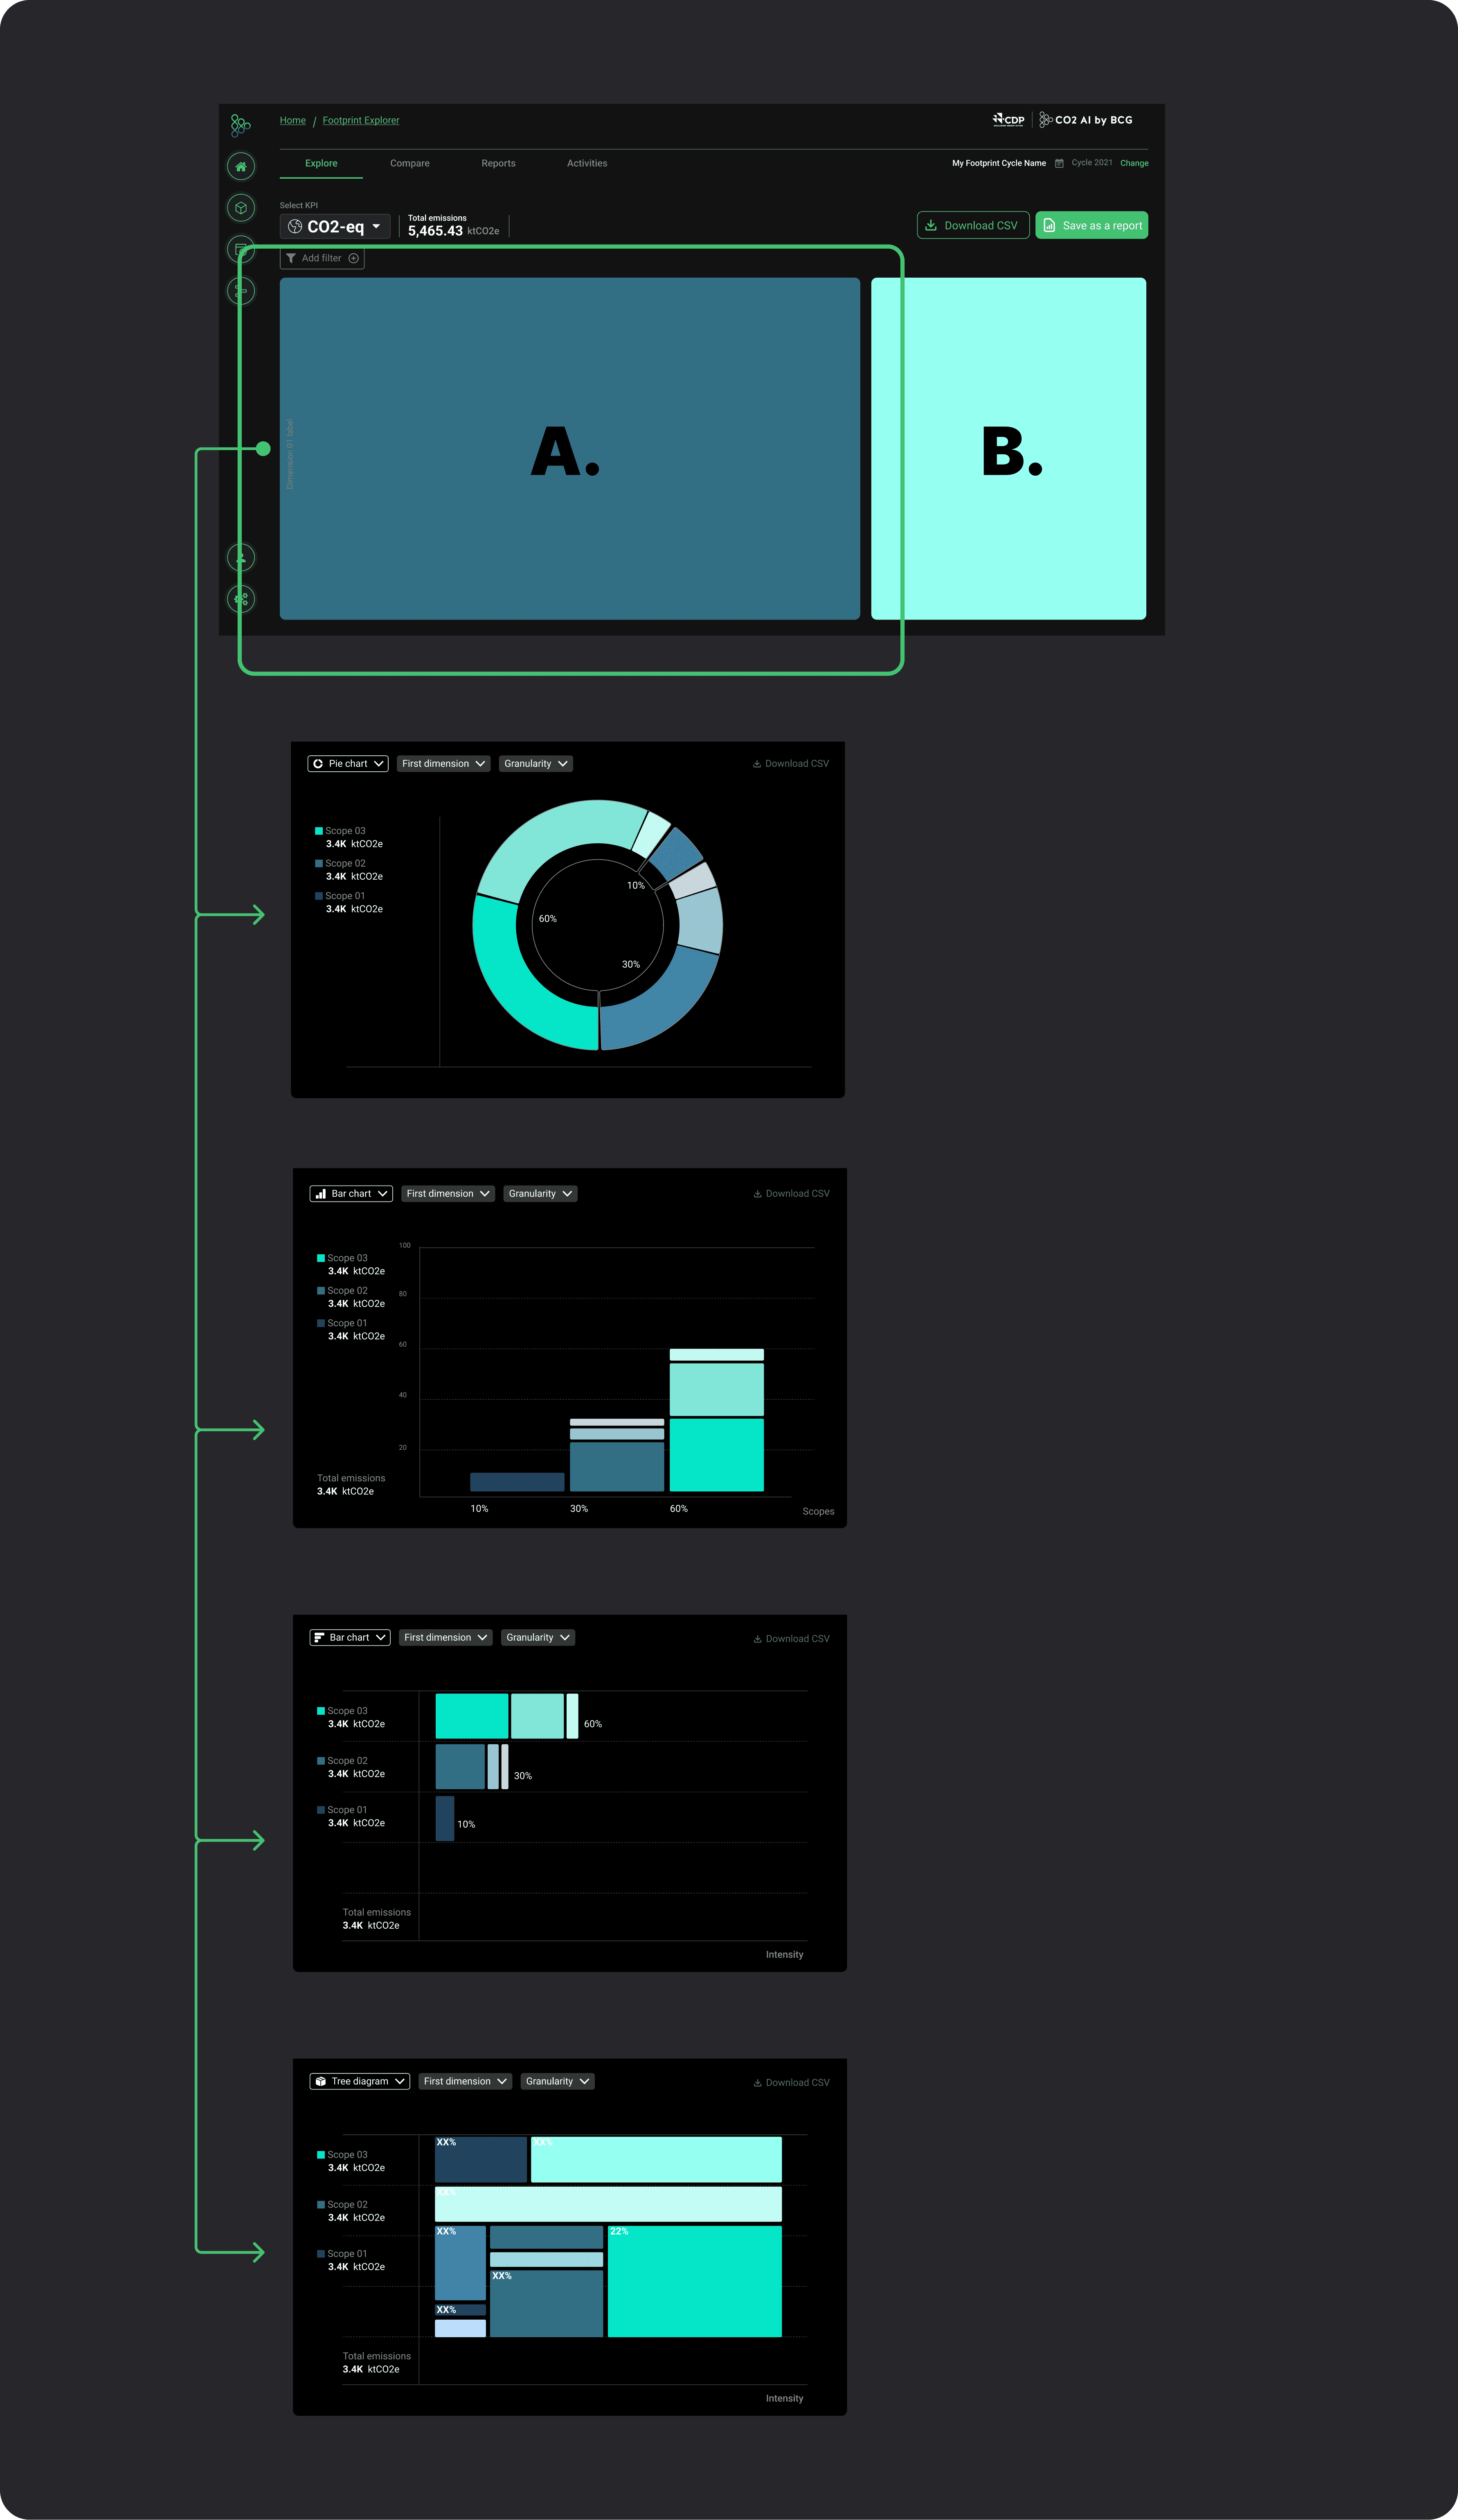
Our goal was to develop multiple visualization and interaction methods that would allow users to deep dive into their emission scopes, identify primary sources of emissions, and model alternative scenarios to assess potential reductions.
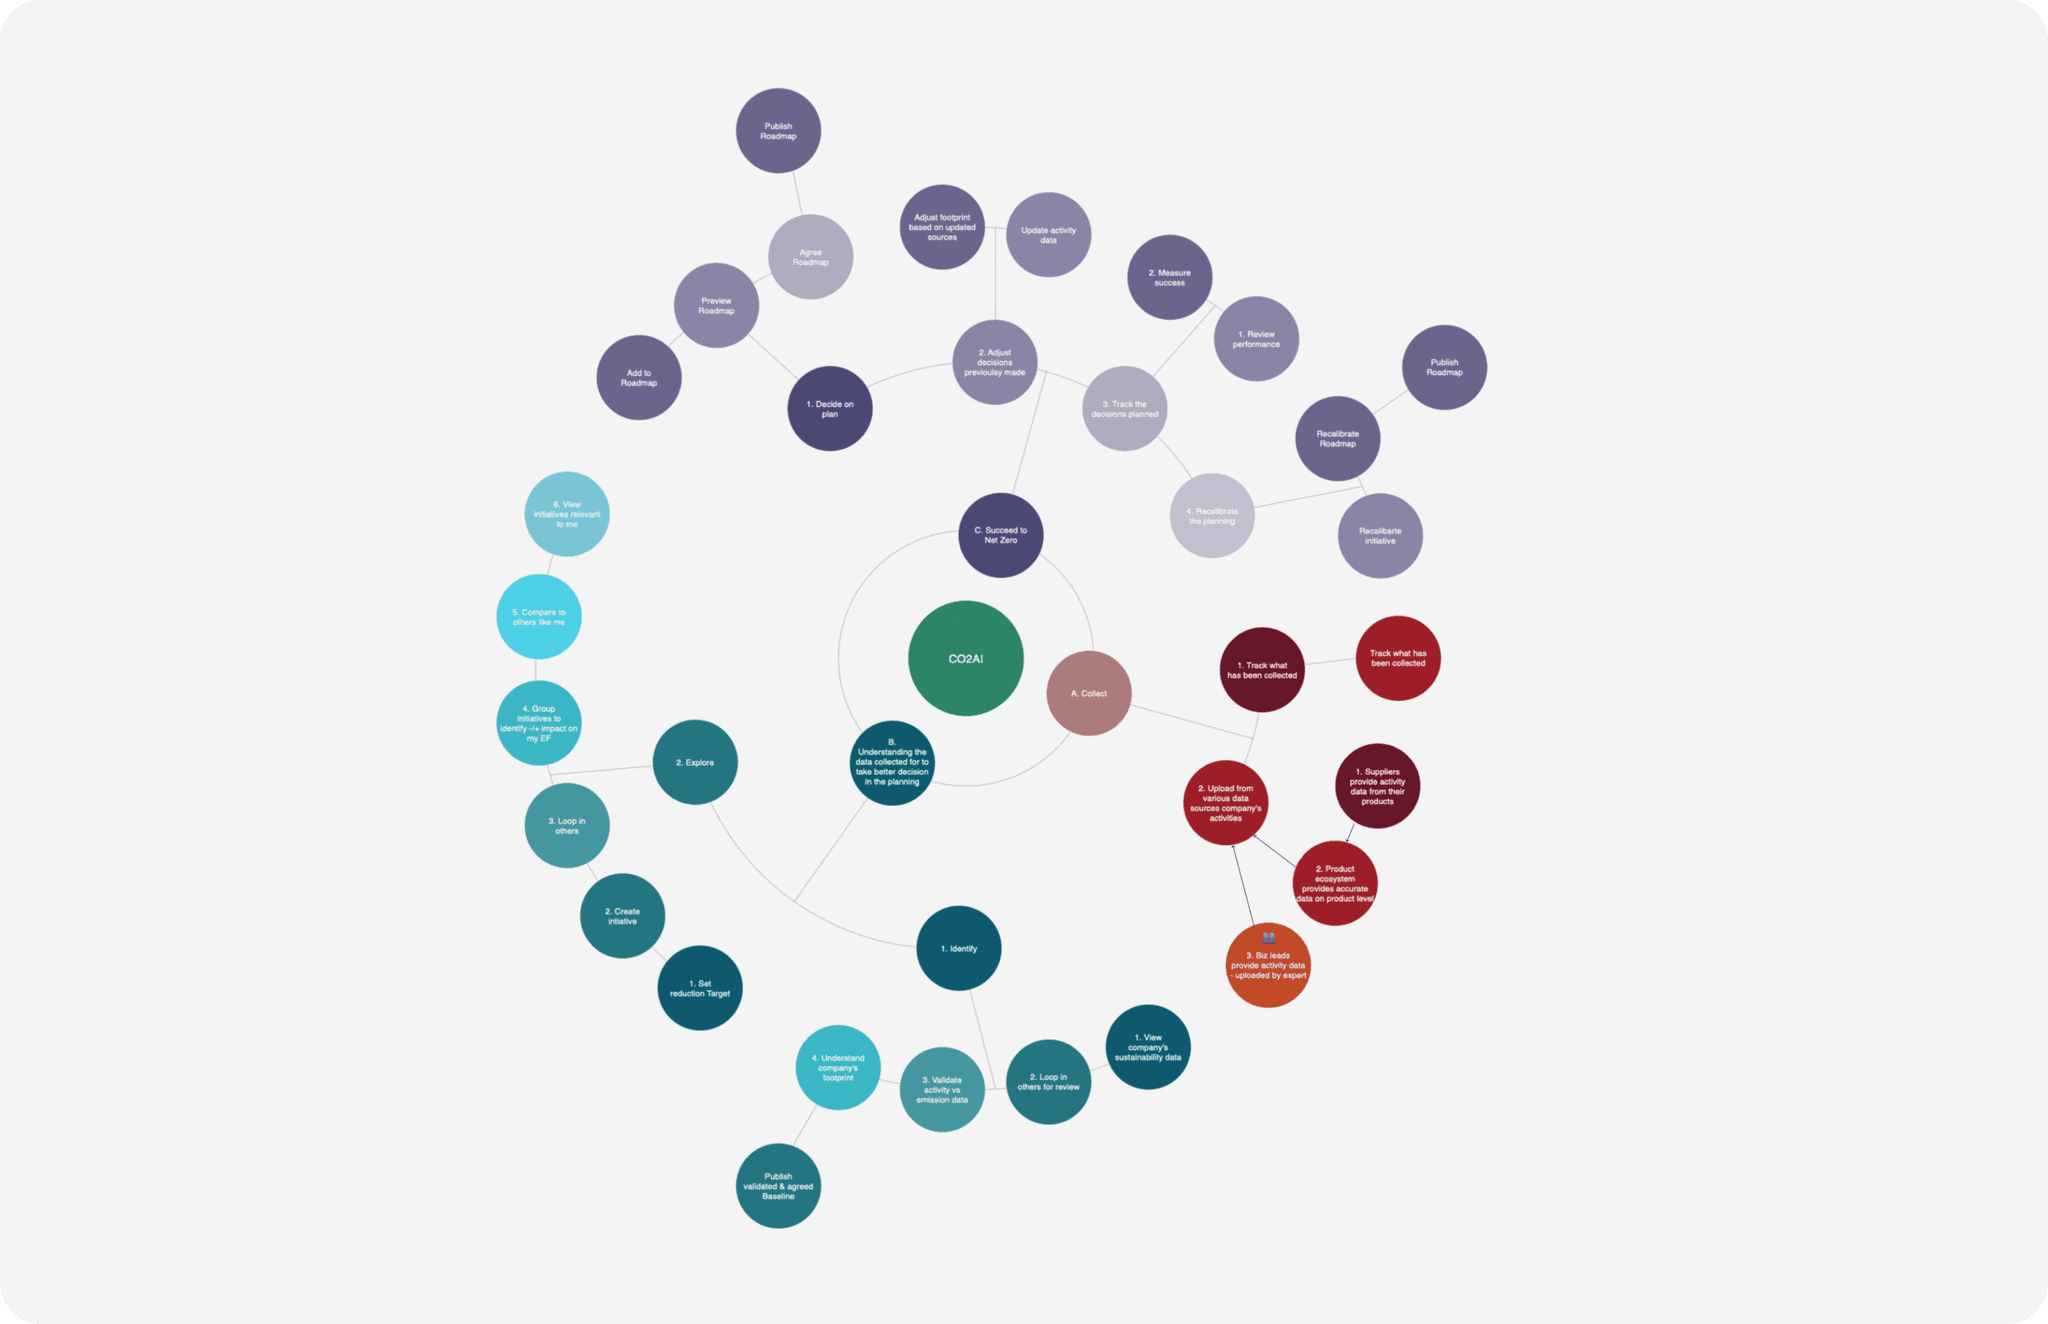
Research and discovery
Our research approach leveraged two primary methods: expert interviews and analysis of existing consulting data. We conducted in-depth interviews with top sustainability experts from five Fortune 500 companies, each leading significant sustainability initiatives within their organizations. These experts provided invaluable feedback and insights into real-world challenges and needs. Additionally, we analyzed comprehensive research results from consultants who had previously implemented sustainability initiatives for individual clients.This data was synthesized to form the foundational insights for our software development.
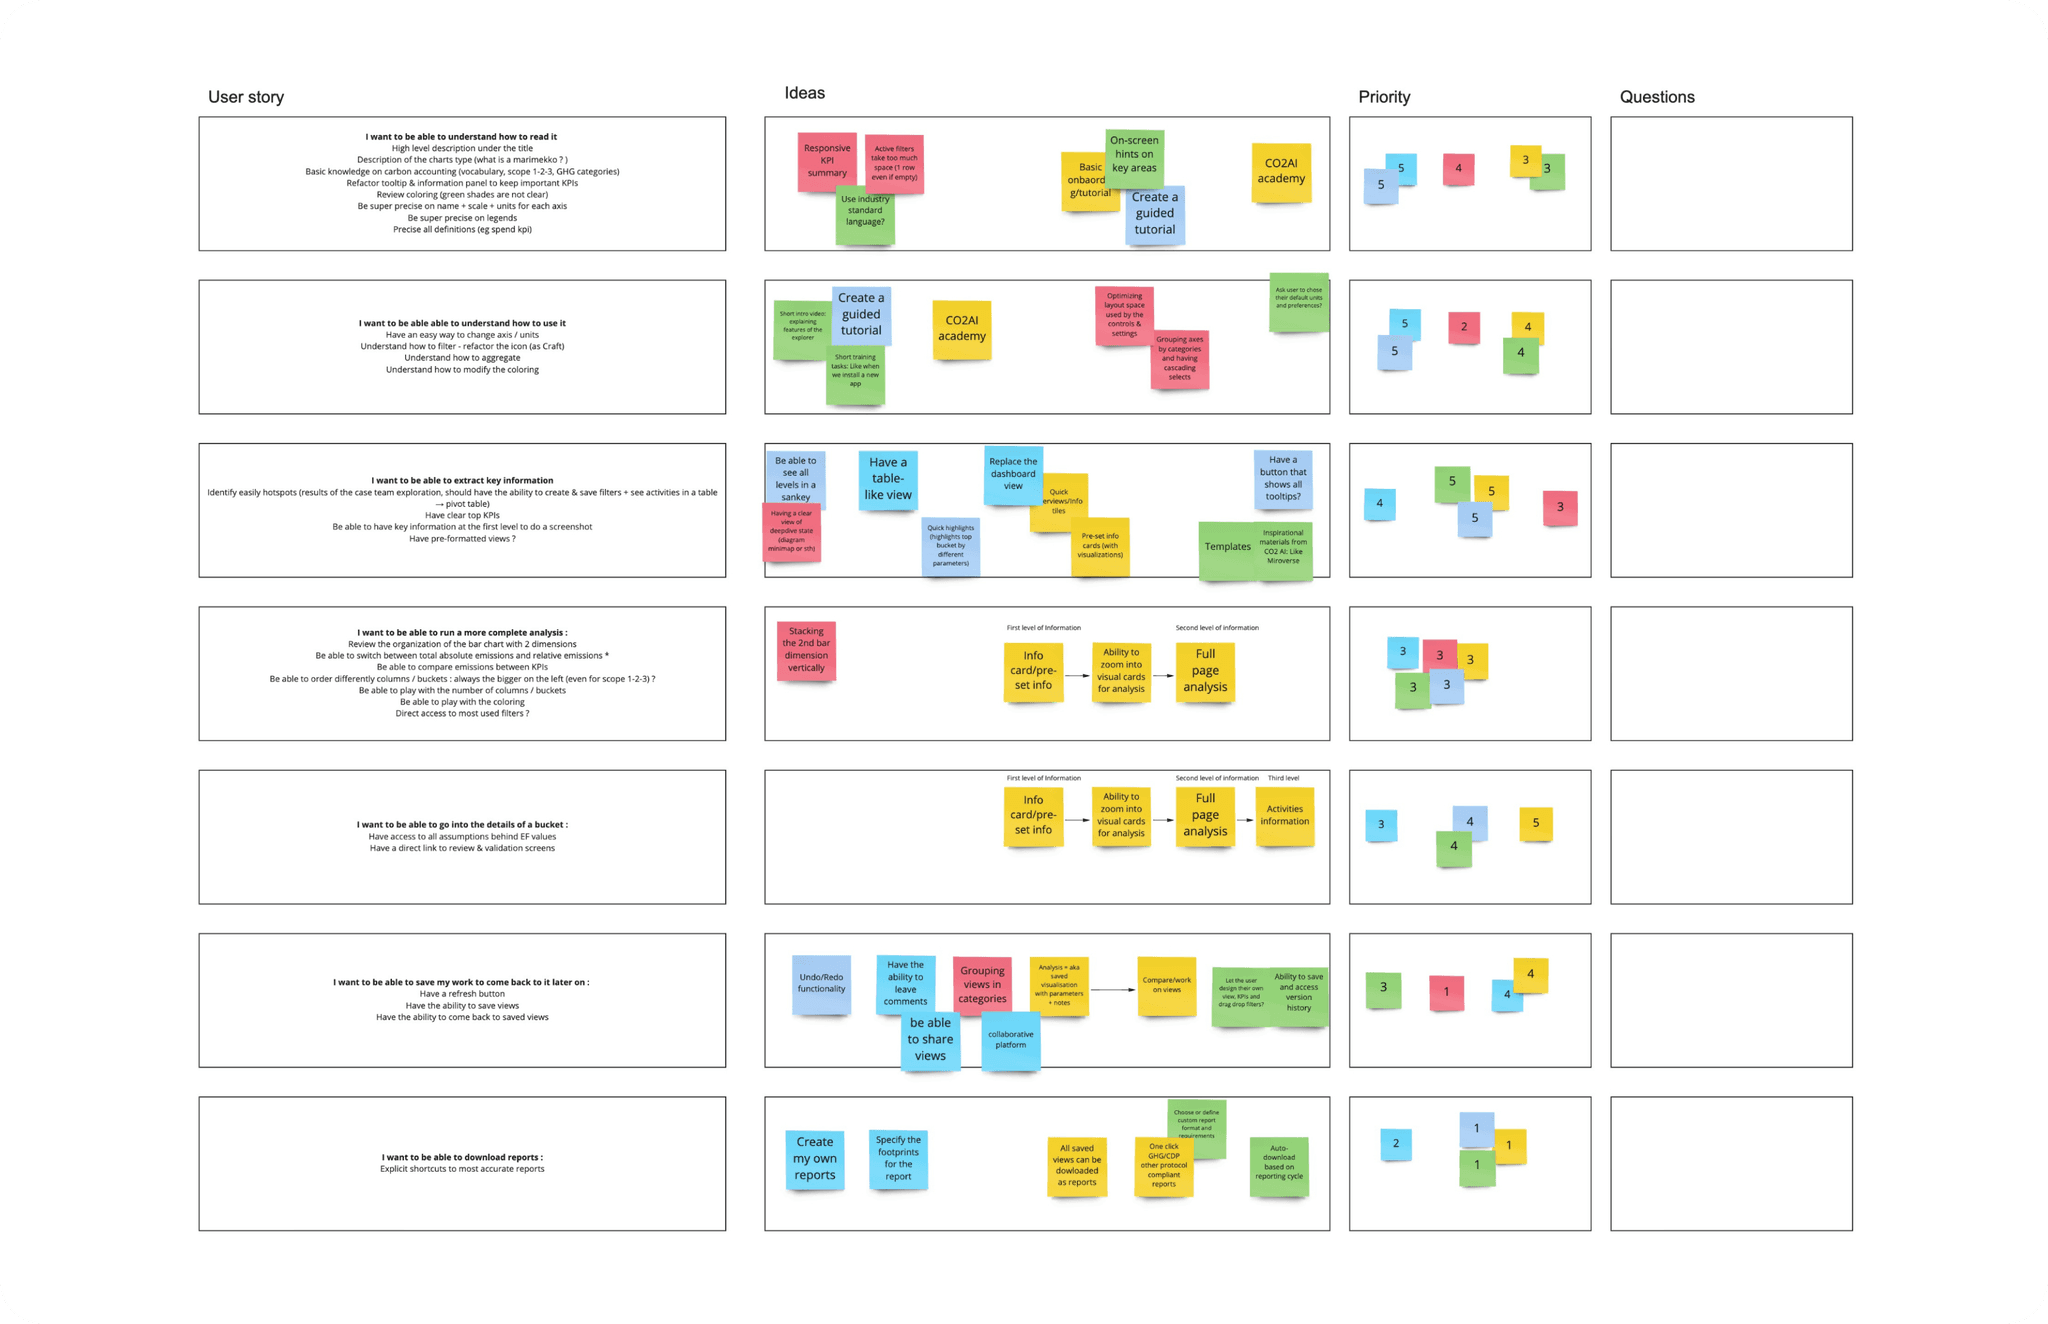
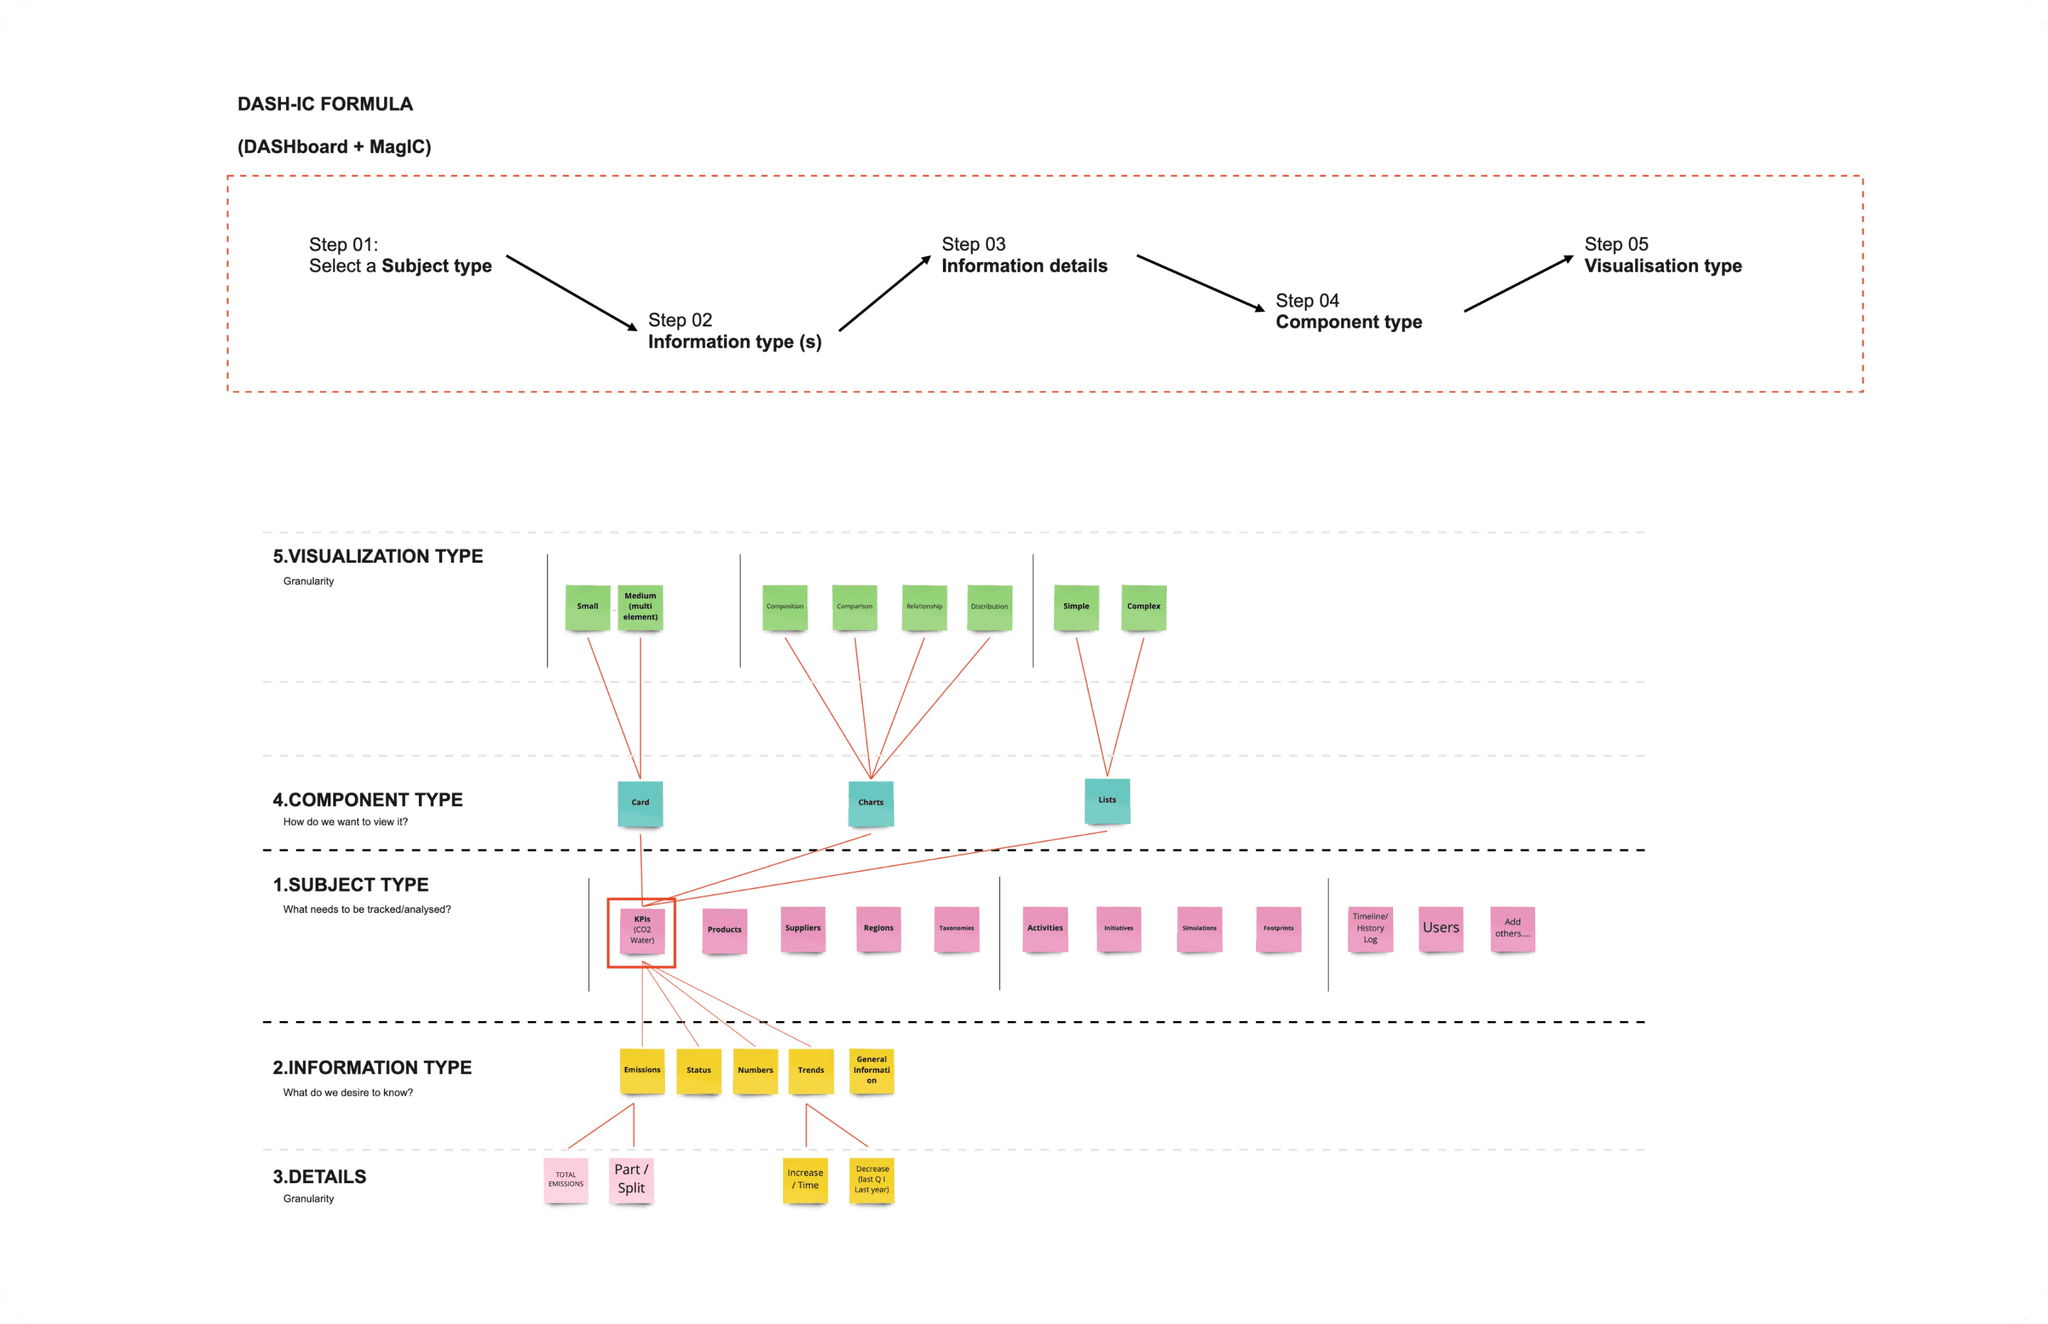
A key insight that significantly influenced our design direction was the need for flexibility and customization in emissions tracking. We learned that while companies shared similar overall goals, their specific needs varied greatly depending on their industry, size, and supply chain complexity. This insight led us to design a modular interface that could be tailored to each organization's unique emission profile and reporting requirements.
Design Process and Solutions
We utilized Figma as our primary tool for wireframing and prototyping, which allowed for collaborative design and iterative refinement of our interface concepts. The design process focused on creating an intuitive and powerful user experience that would transform complex emissions data into actionable insights.
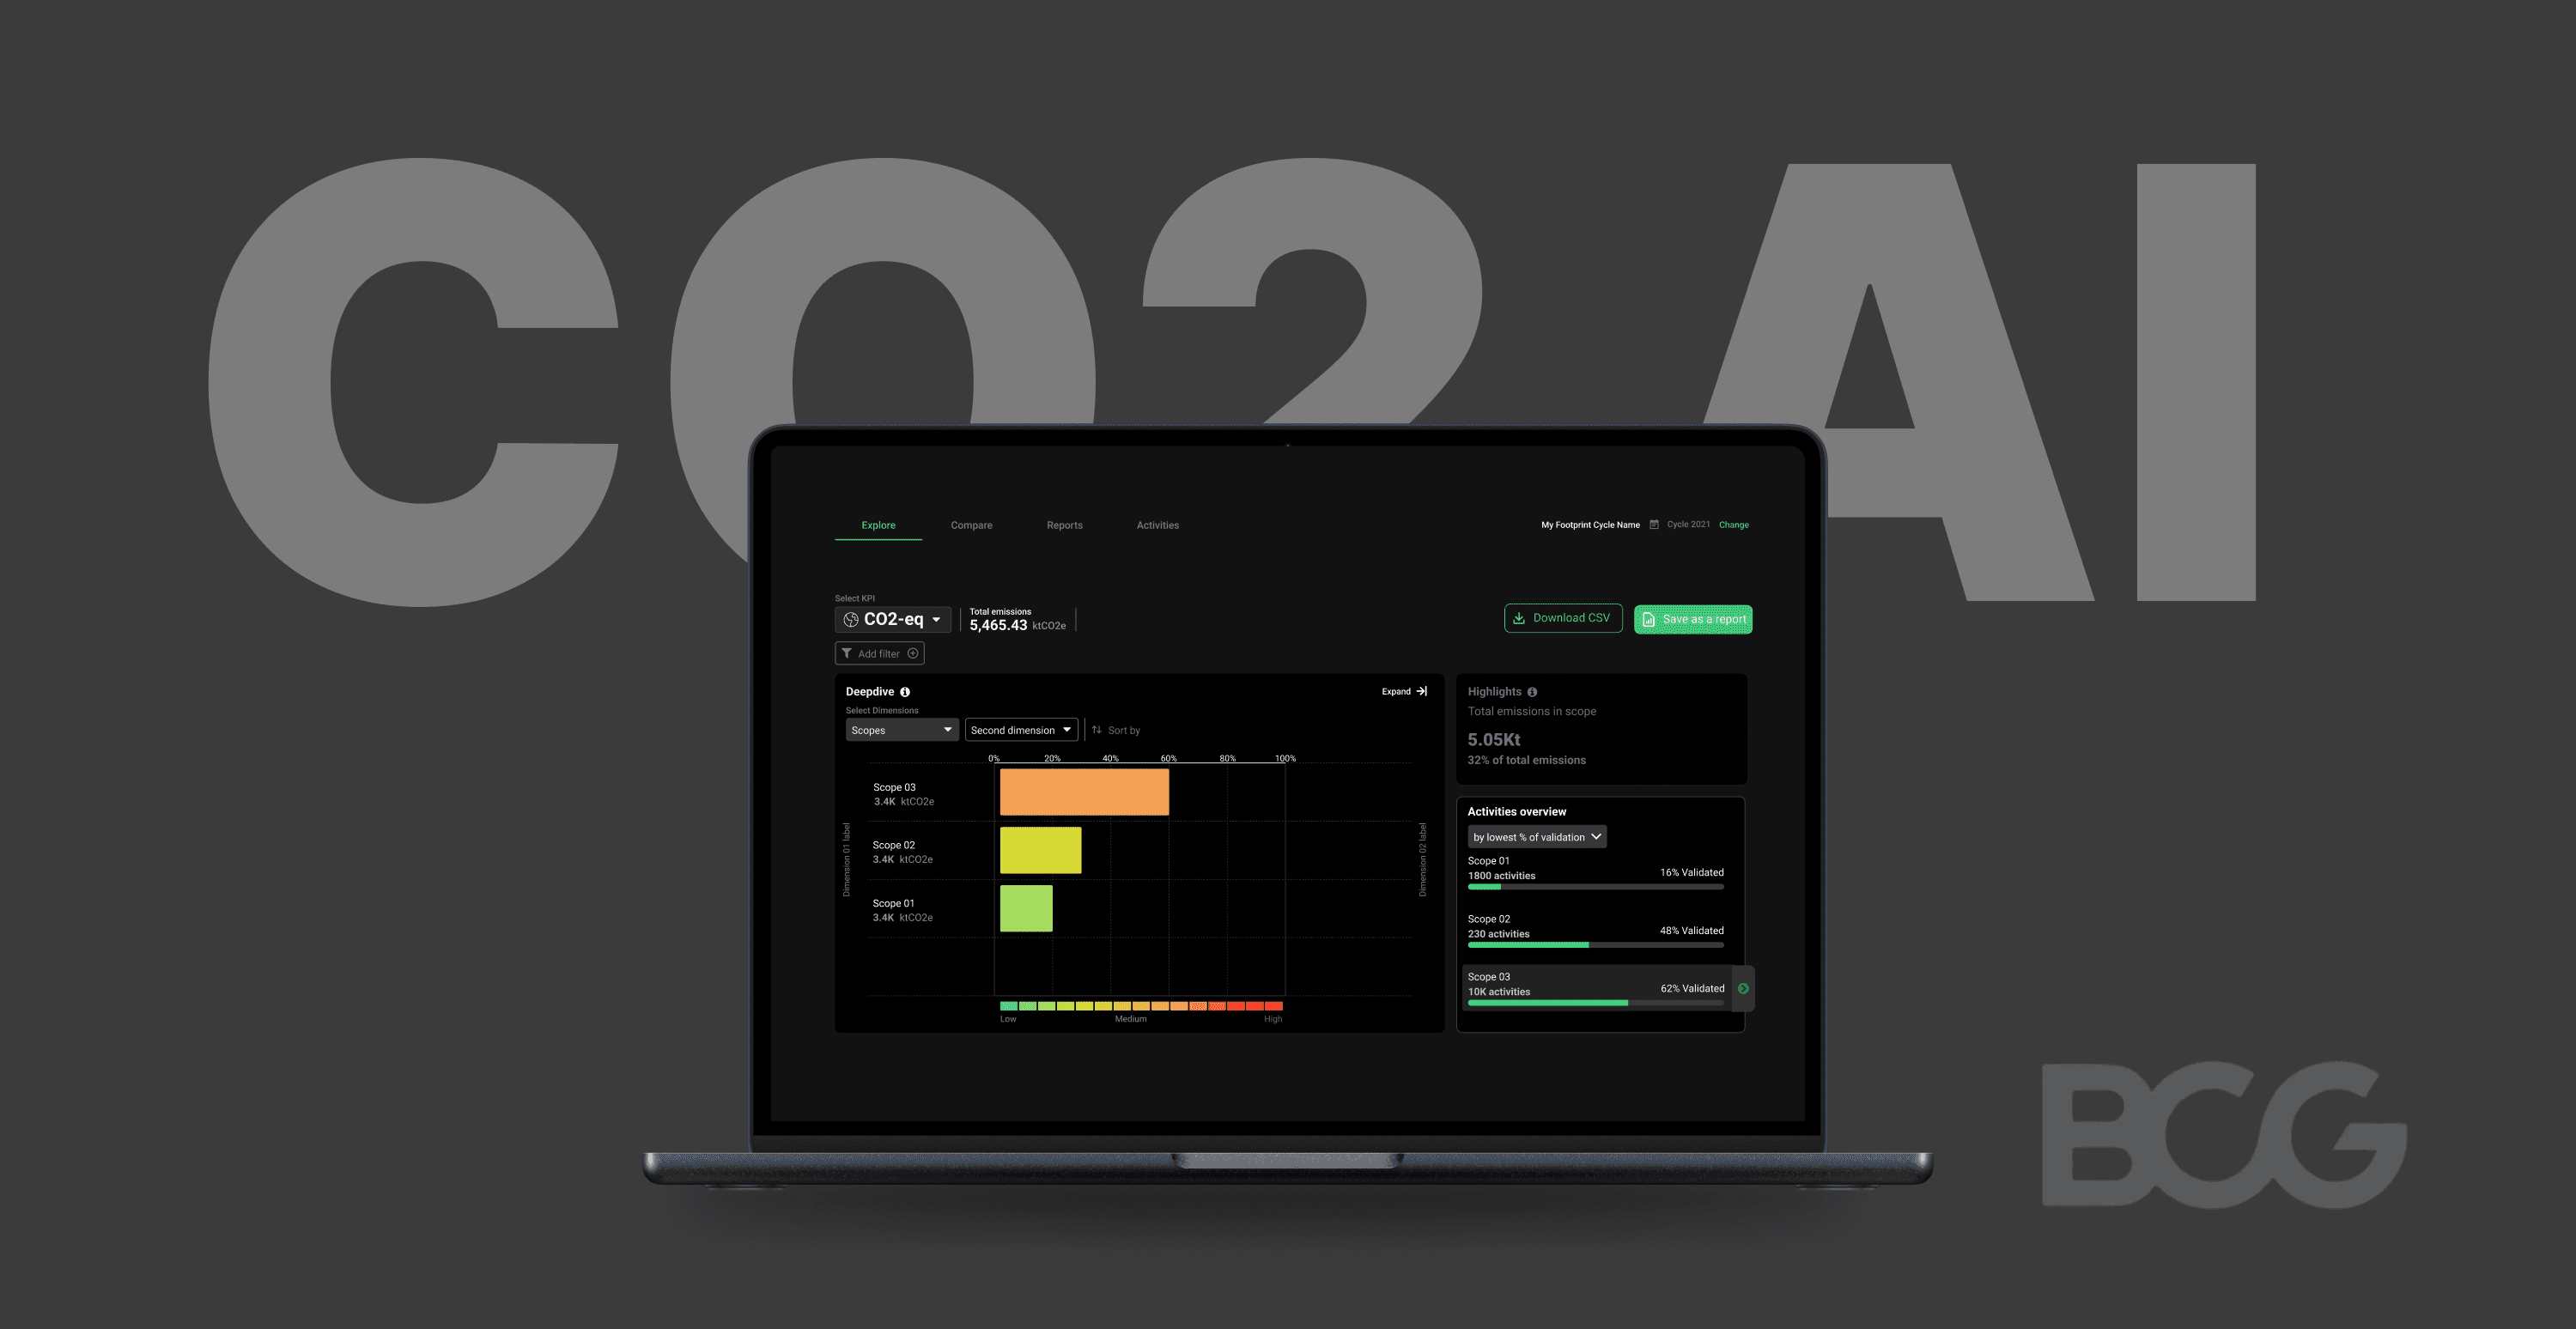
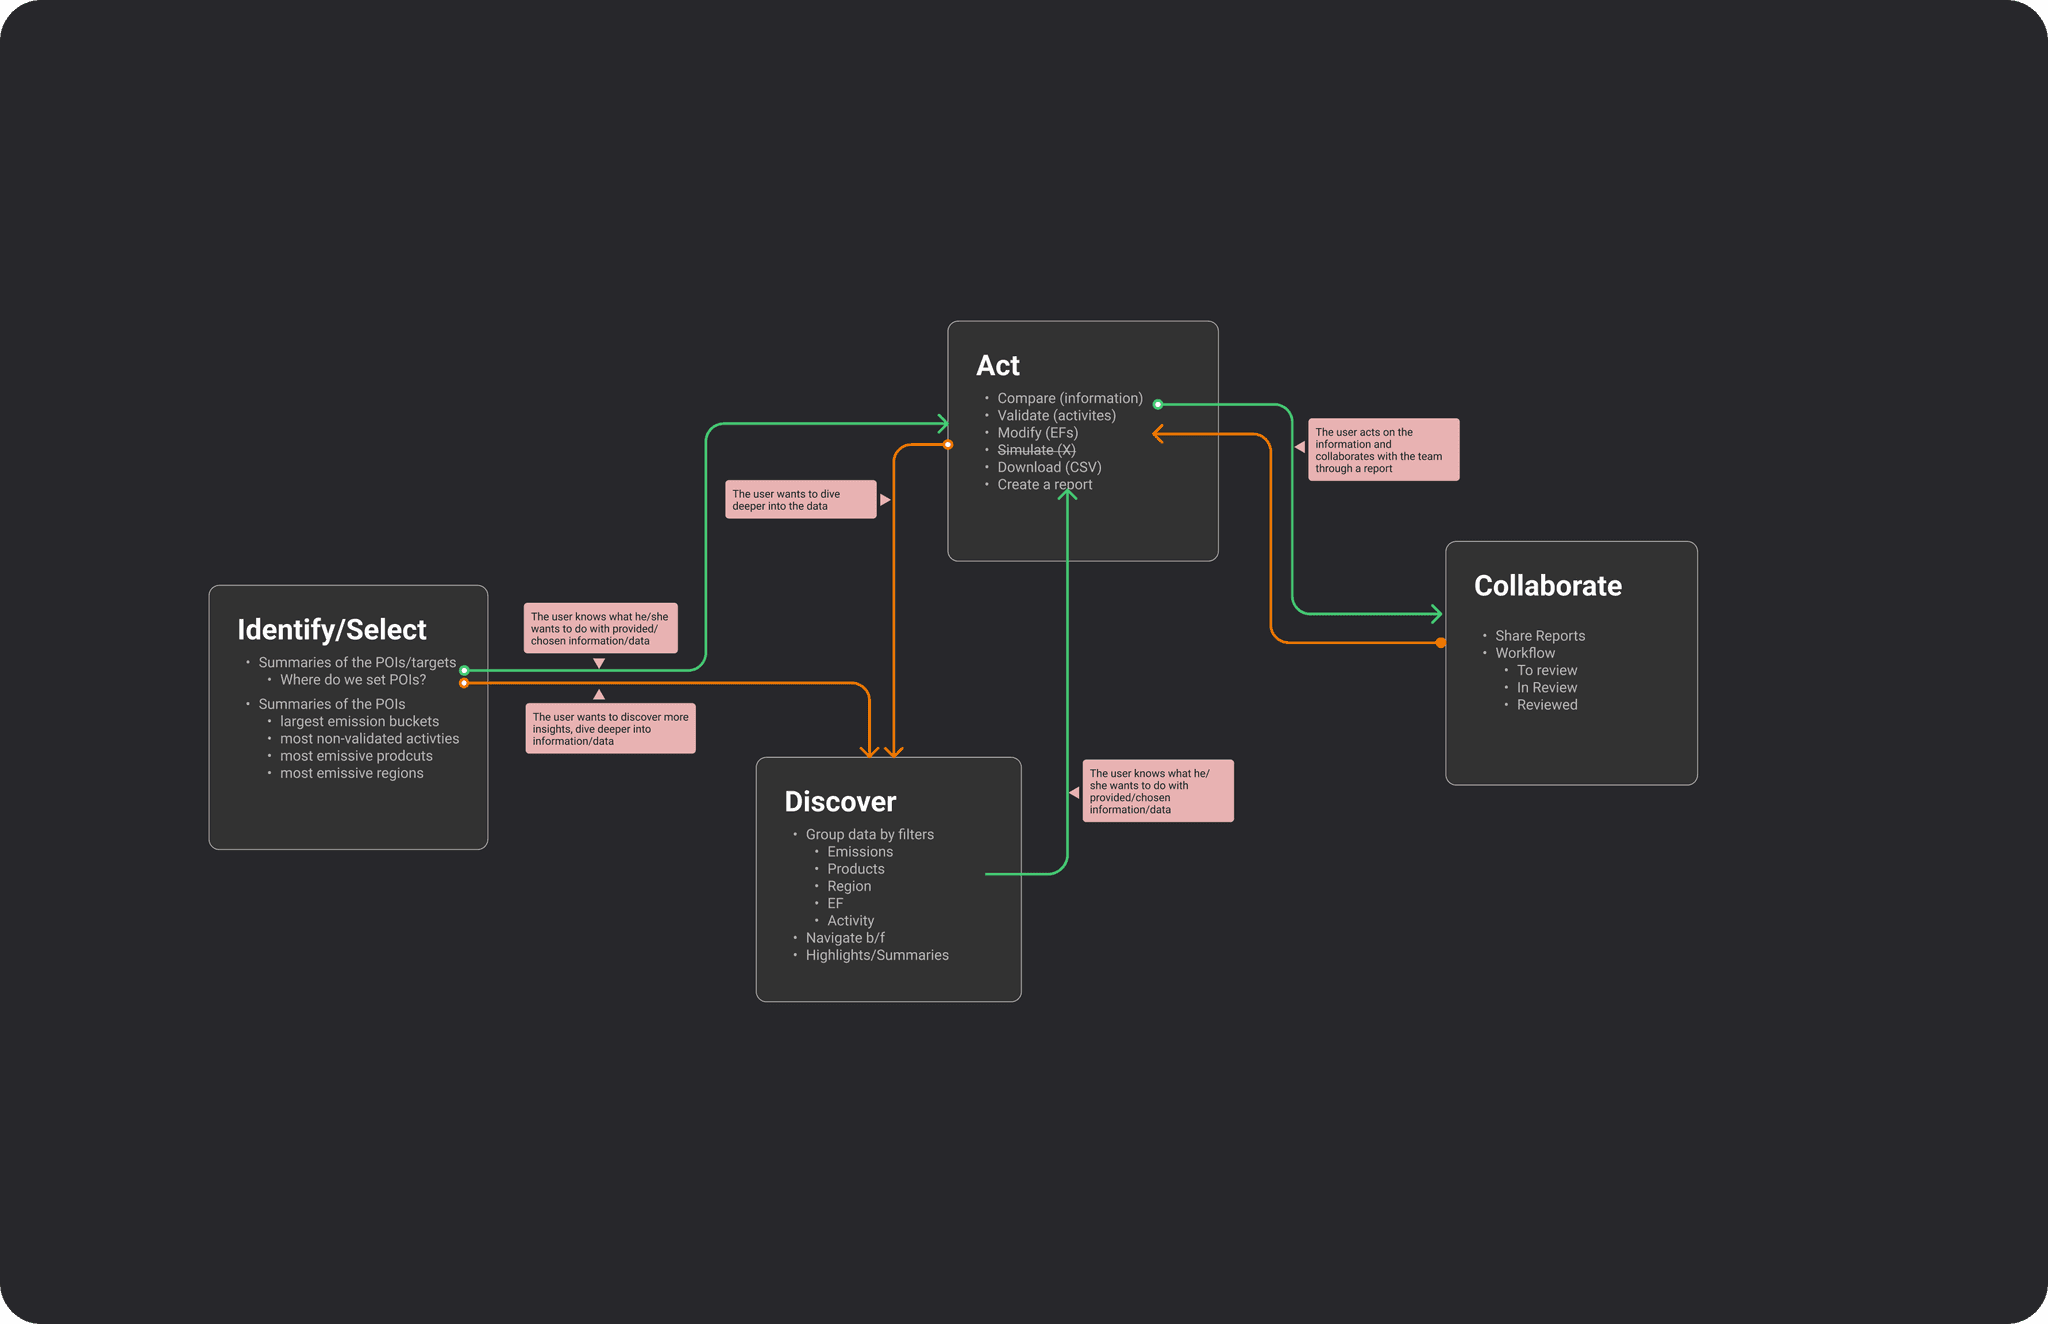
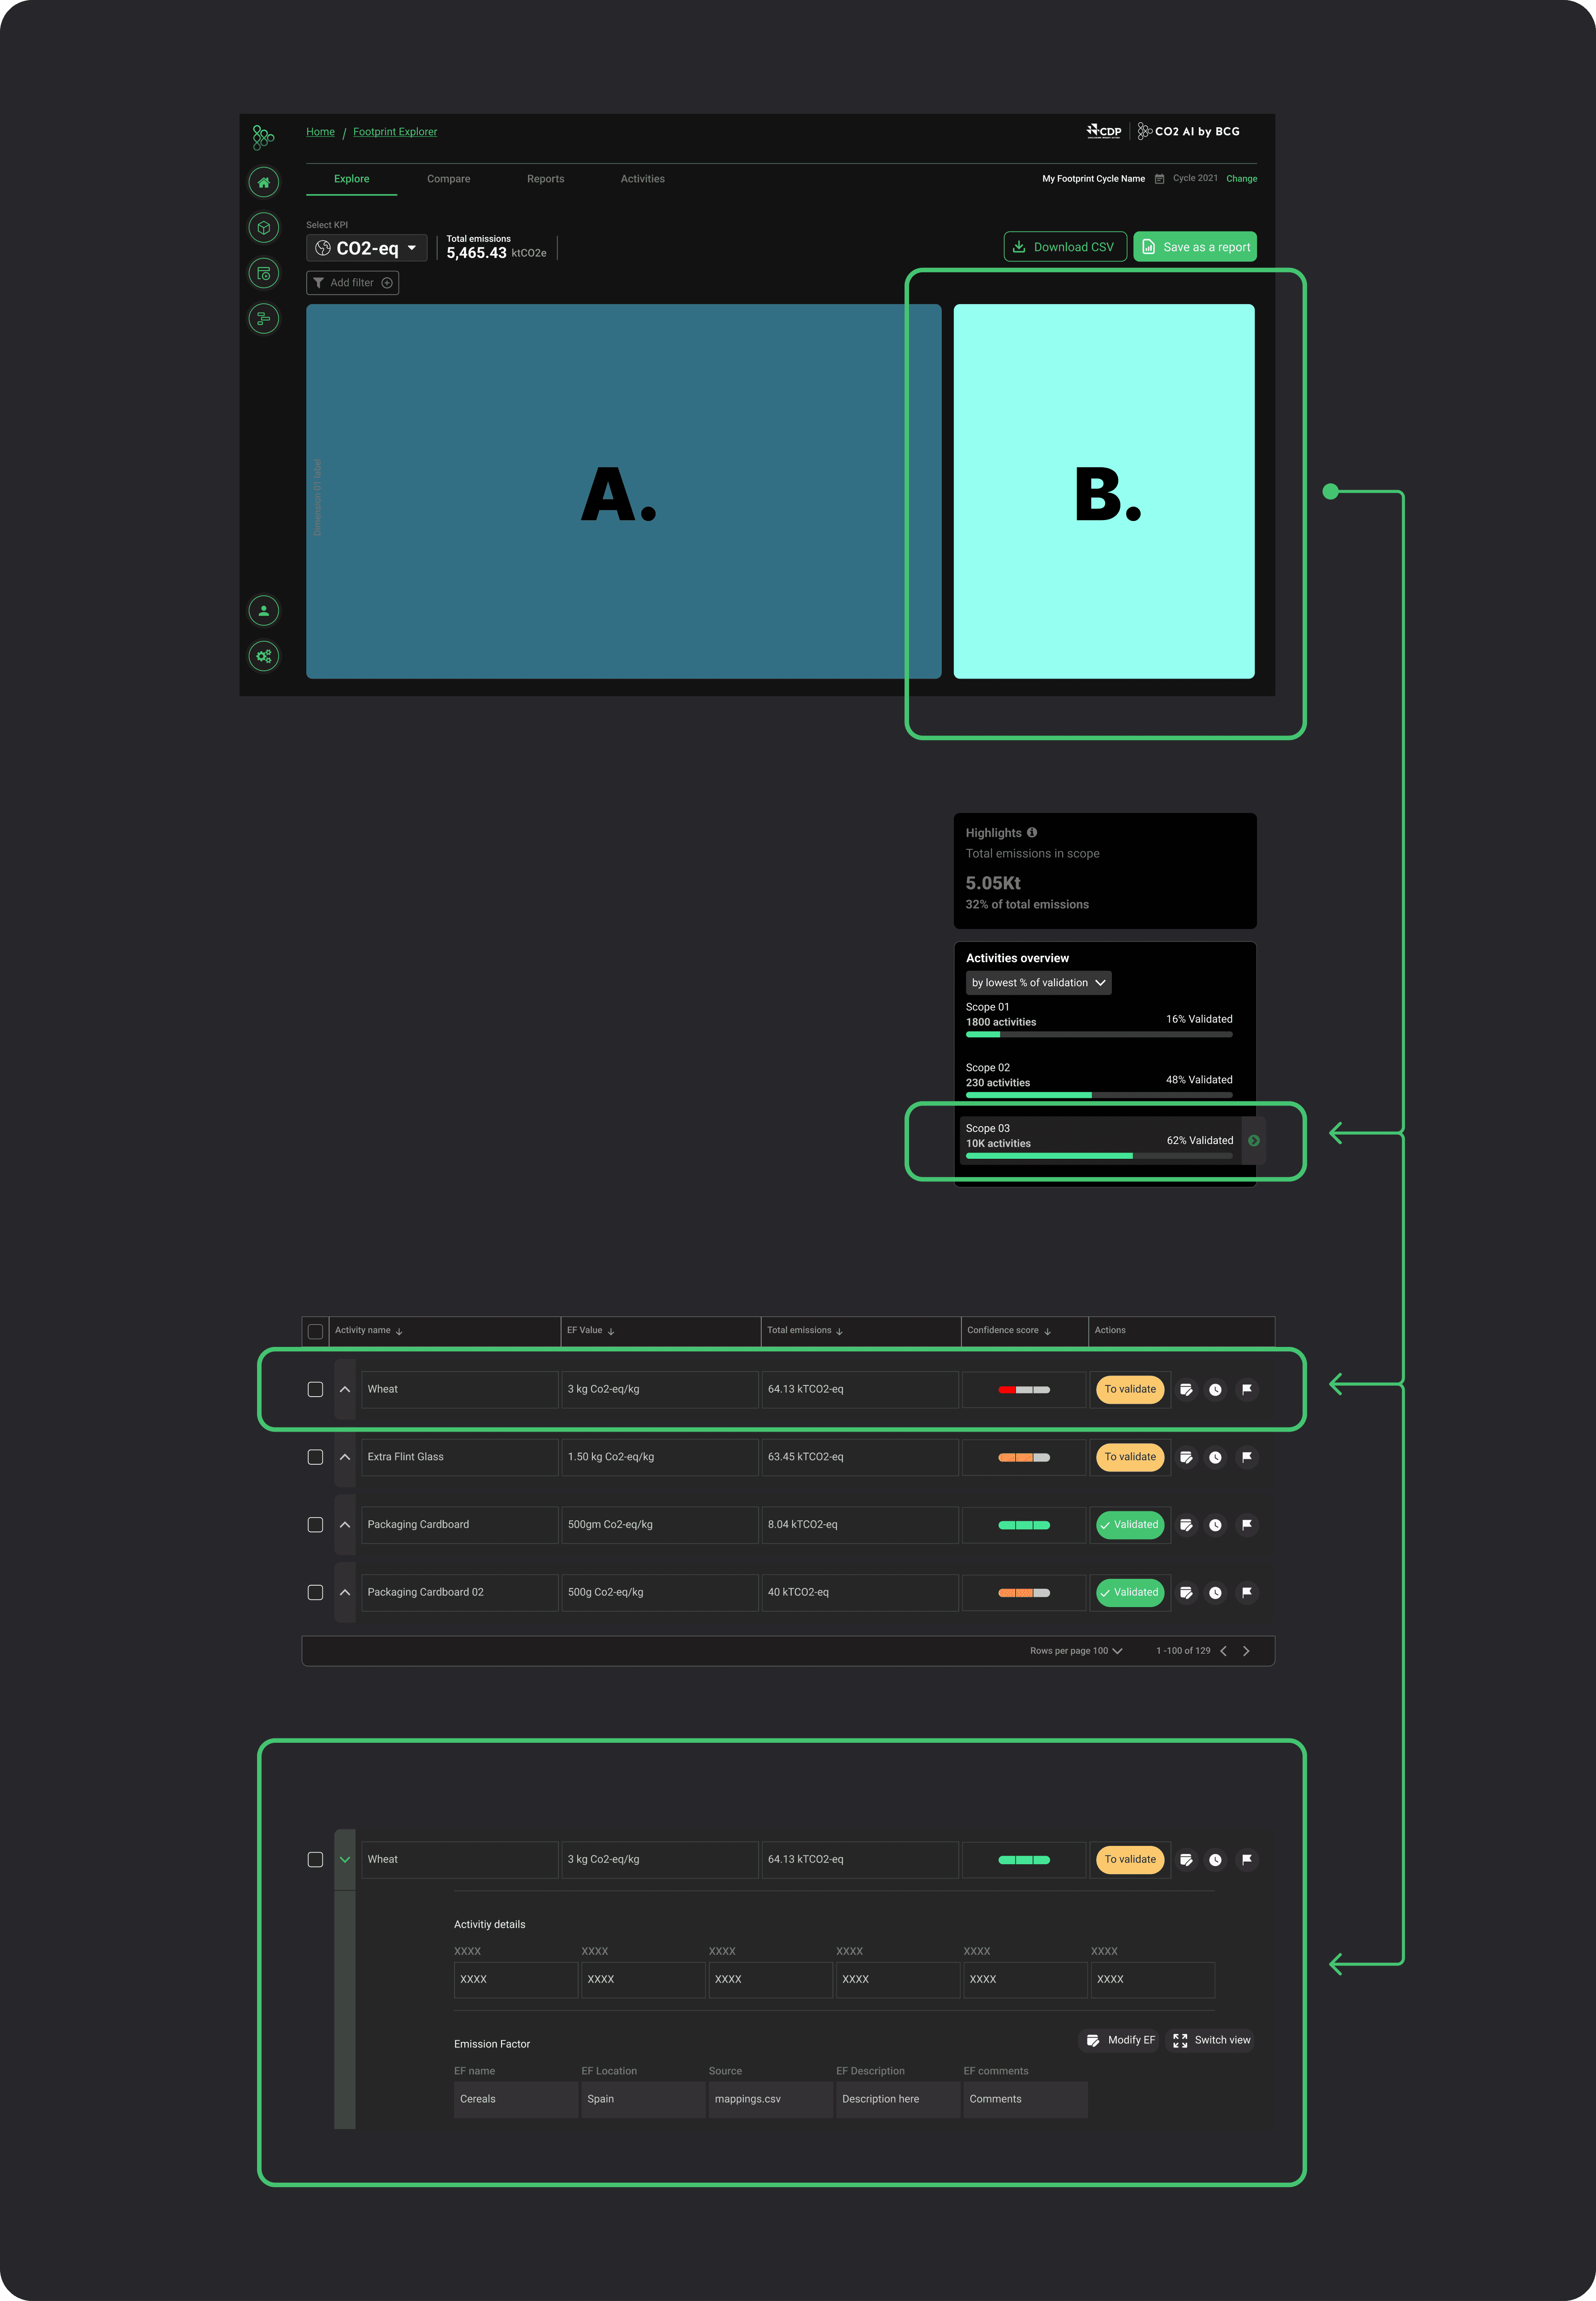
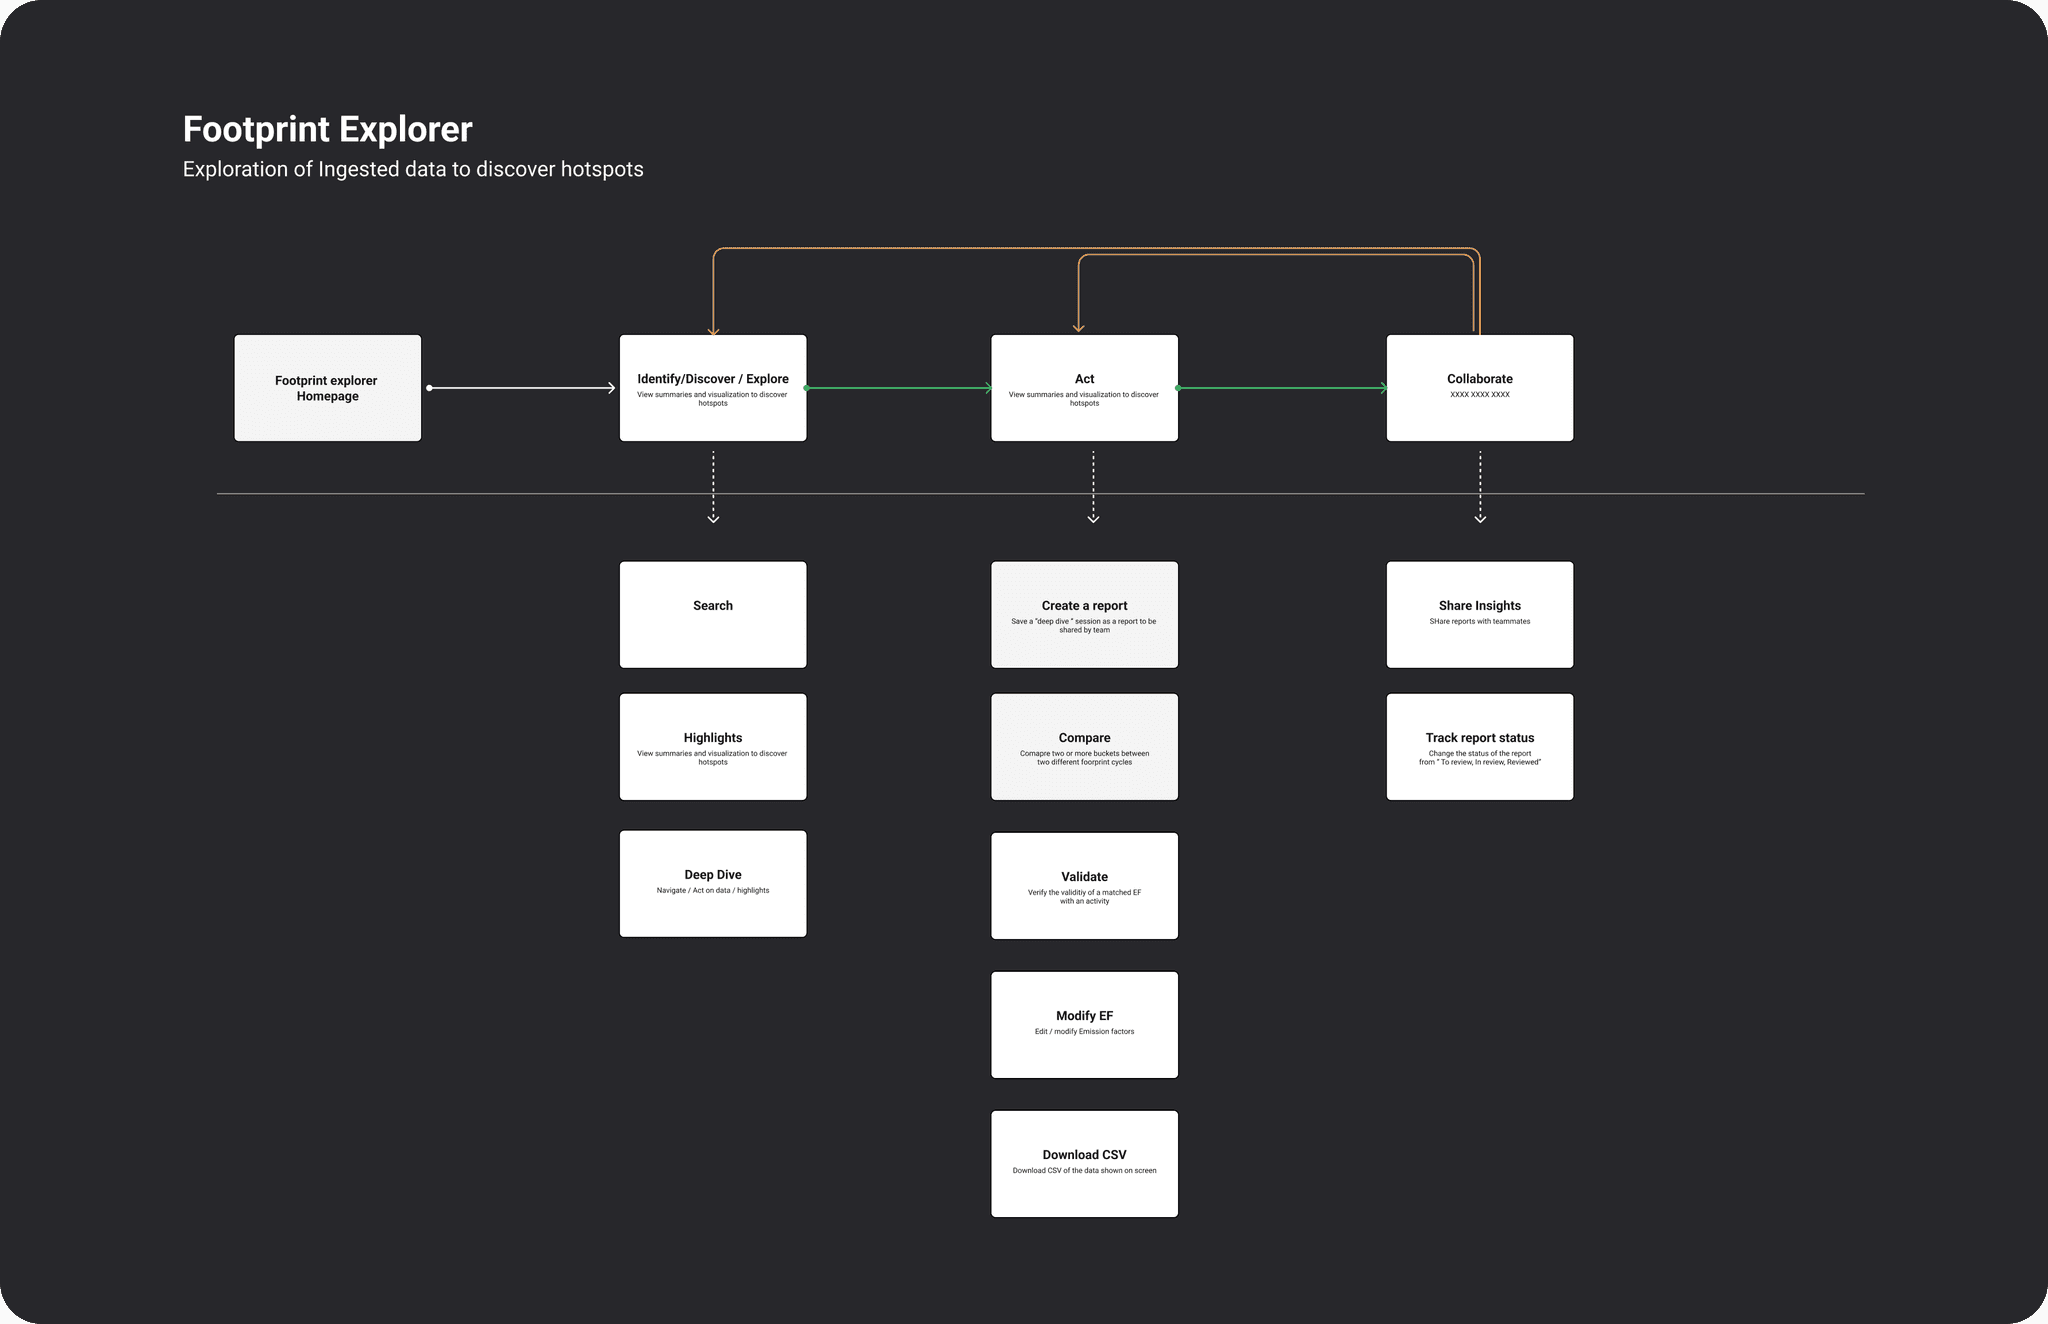
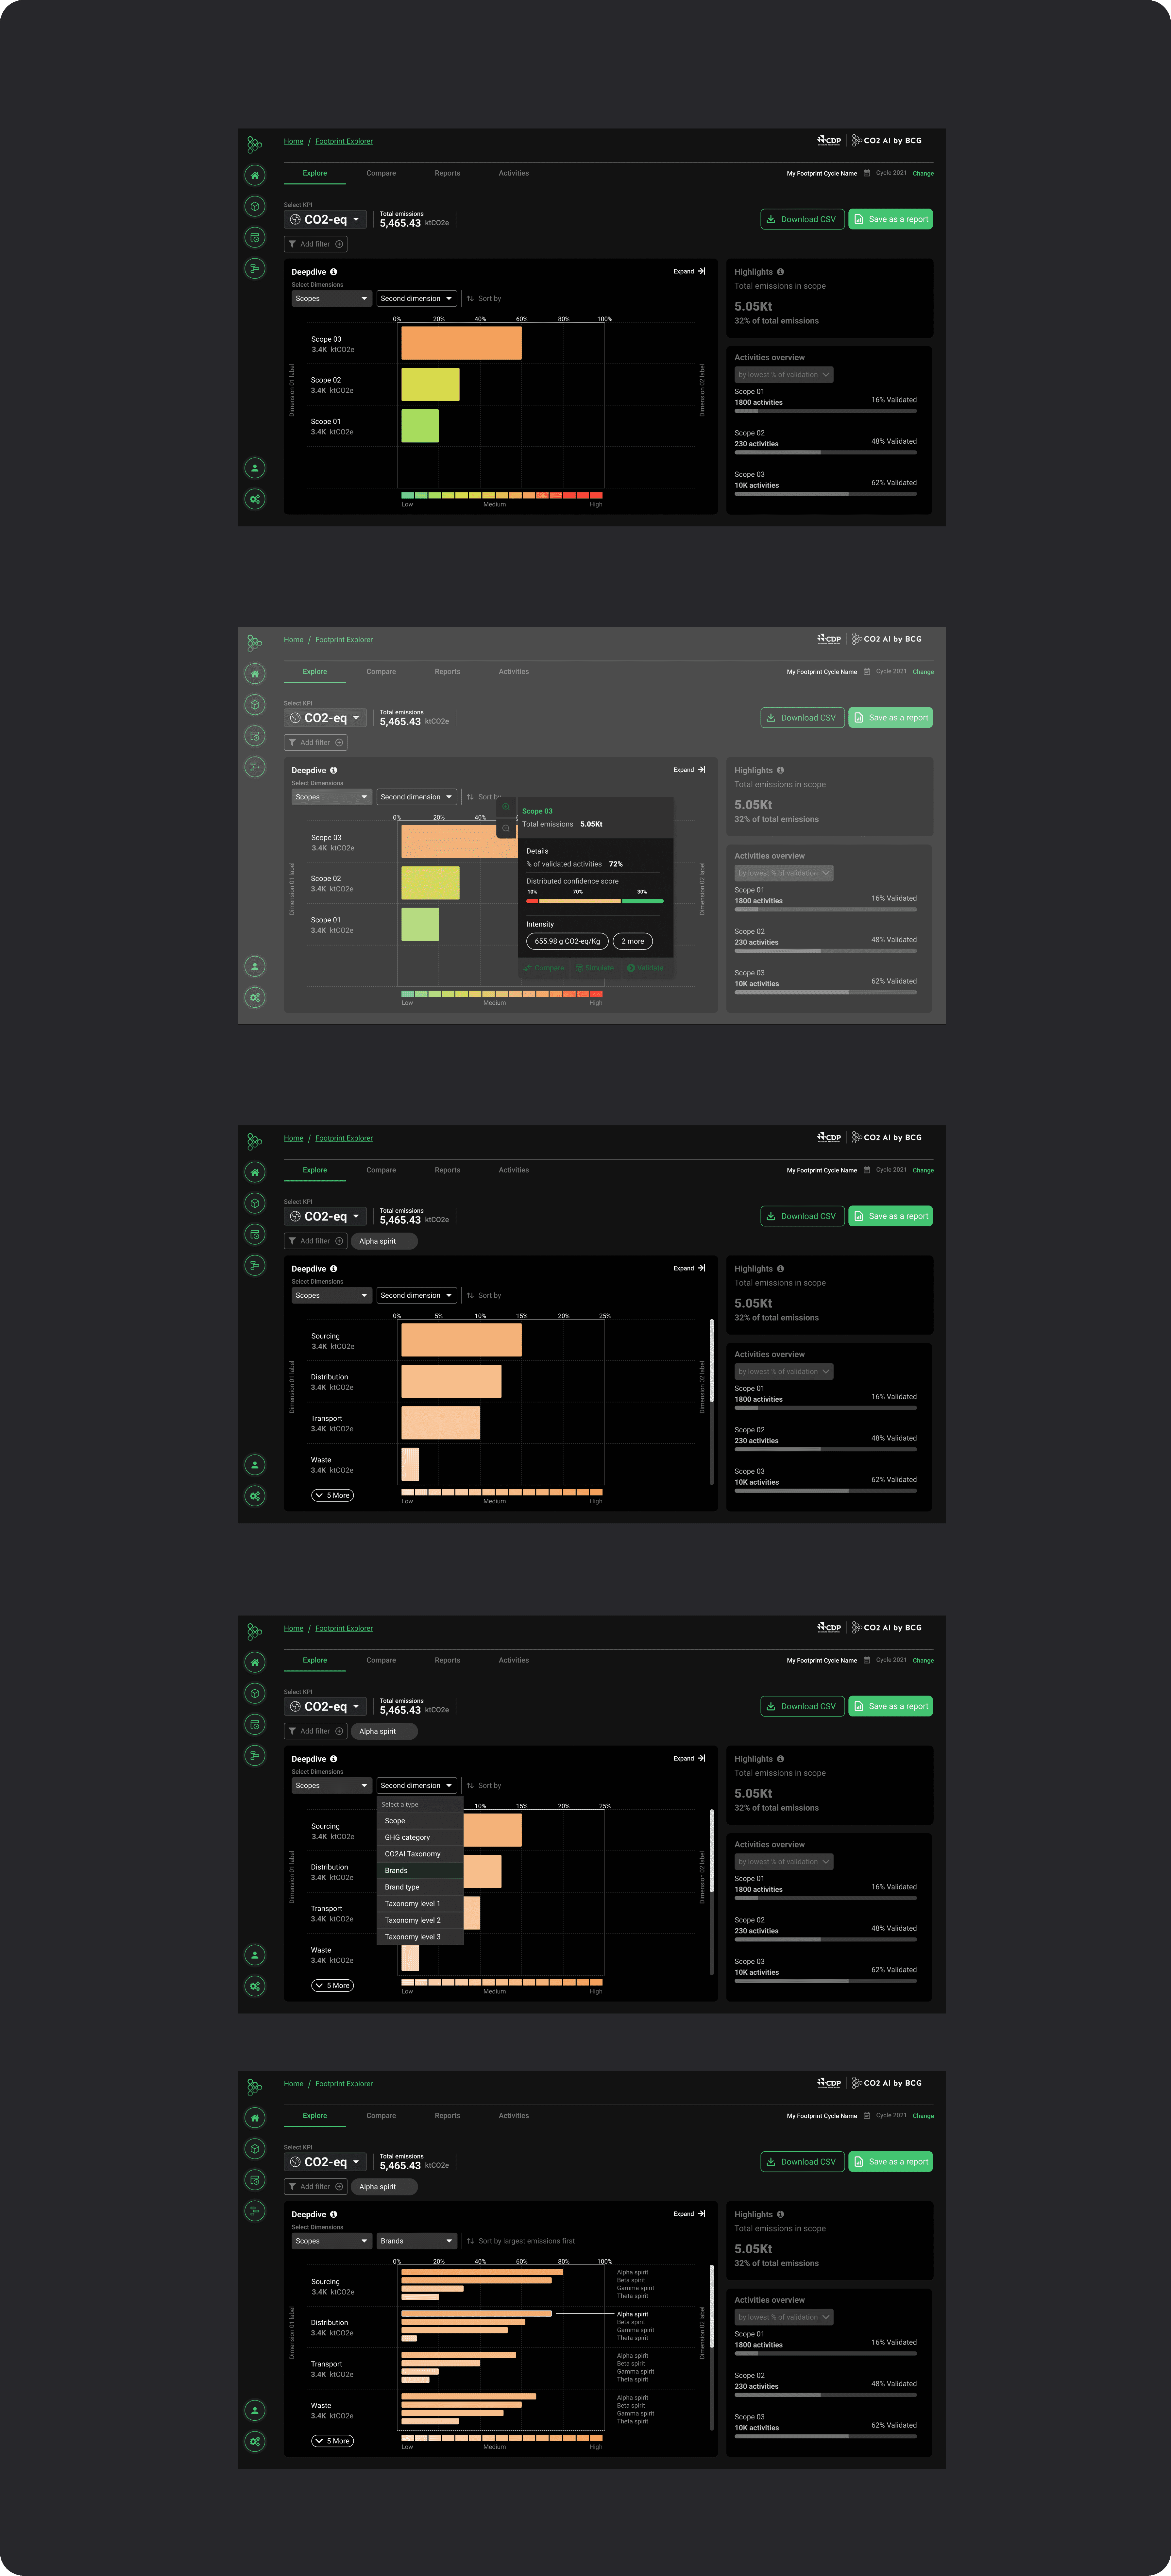
A key feature we developed was a multi-layered deep dive system that allowed users to explore different emission scopes in detail. This unique interface enabled users to view all activities related to a specific scope, then further investigate the underlying emission factors. Users could manipulate various parameters to model the impact on overall emissions over a five-year projection. This feature addressed the critical need for both detailed analysis and future planning.
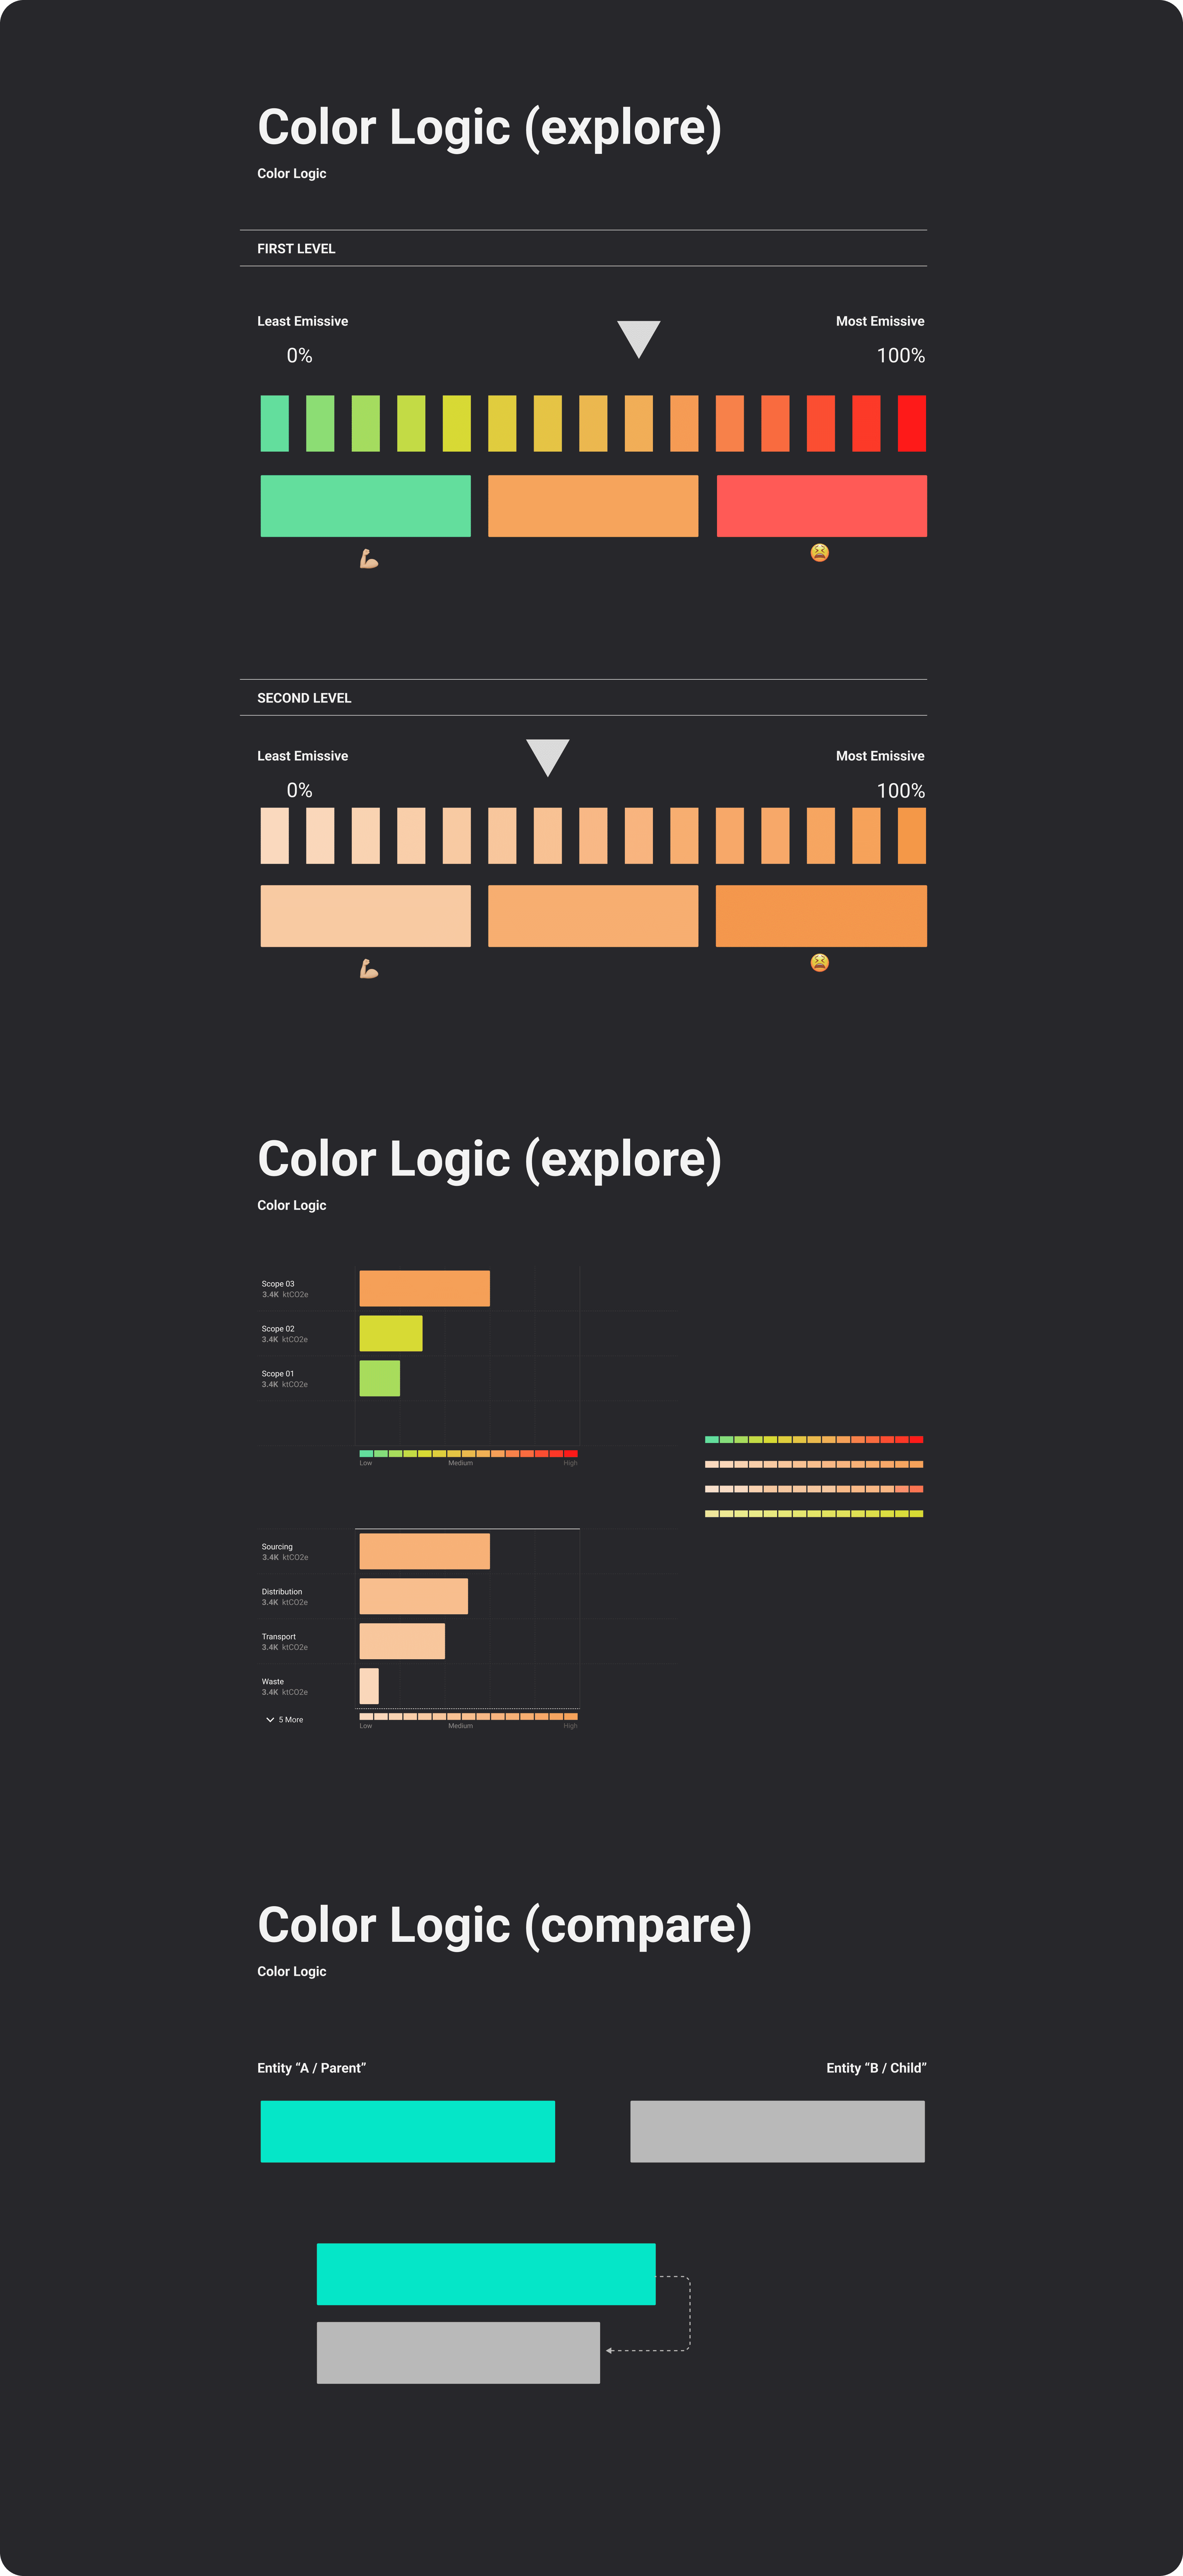
Complementing this, we created a dynamic visualization system that adapted to different levels of data granularity. Unlike traditional emissions reporting, which often relies on static Excel sheets, our platform offered a variety of charts and visual representations that changed based on the user's current depth of analysis. This approach significantly improved the onboarding experience and made complex data more accessible and actionable for users at all levels of expertise.
User testing and iteration
Our user testing process was comprehensive and iterative, involving multiple rounds of testing with diverse user groups. While I didn't conduct the testing directly, our dedicated user research team provided valuable insights from their sessions with various organizational roles.
A critical finding from the user testing was the significant variation in how different types of users within an organization interacted with and interpreted emissions data. For instance, sustainability managers required detailed, granular views, while C-suite executives needed high-level summaries and trend analyses. This insight led to our most significant design change: implementing role-based dashboards and customizable views.
We redesigned the platform to offer tailored interfaces and visualizations for different team roles. For example, we created executive summaries with high-level KPIs and trend charts for leadership, detailed data entry and validation tools for sustainability teams, and comparative analyses for operations managers. This flexible approach ensured that each user could access the most relevant information and tools for their specific needs, greatly enhancing the platform's utility across the organization
Outcomes and reflections
The innovative design solutions we implemented for CO2AI led to significant success in the market. Our platform quickly gained traction among Fortune 500 companies, with industry giants like Disney and L'Oréal adopting the solution early on. This rapid adoption by high-profile clients validated our user-centric design approach and the effectiveness of our multi-layered, role-based interface.
A major achievement was establishing an industry-wide partnership with the Carbon Disclosure Project (CDP), a leading carbon regulatory body. This collaboration allowed us to build a product ecosystem specifically for scope three emissions, addressing a critical need in the sustainability reporting landscape. The success of our design and its market impact attracted substantial investor interest, resulting in a $12 million funding round from top Silicon Valley and European investors, as well as additional backing from our parent company, BCG.
The biggest challenge we faced during this project was balancing the need for comprehensive, detailed emissions data with creating an intuitive, user-friendly interface. The complexity of emissions data and the diverse needs of different user roles within organizations initially seemed at odds with our goal of simplifying sustainability reporting. We overcame this challenge by adopting a modular, role-based design approach. This allowed us to provide detailed data for specialists while offering simplified views for executives, effectively catering to all user needs within a single platform.
This project underscored the importance of user research and flexible design in tackling complex data visualization challenges. The success of CO2AI demonstrated that well-designed UX can not only improve user satisfaction but also drive significant business outcomes and contribute to important global sustainability efforts.
